HKSTP Ideation Programme
The Operating System for Civic Intelligence.
"Turning the noise of the city into a precise, real-time credit score."
Section A
Our Mission
Every million-dollar decision deserves real-time civic intelligence.
We're building the first geo-centric social layer for capital allocation — where developers, retailers, and enterprises can quantify the invisible risks that delay projects, close stores, and waste millions.
Our City Health provides real-time civic intelligence for location-based decision-making — turning neighborhood sentiment into actionable risk metrics. Starting with Physical Asset Owners (Real Estate, Retail) and expanding to Scale Markets (Insurance, Government, Logistics, Corporate Security).
70%
of housing projects delayed by community opposition (NIMBYism)¹
15-25%
of project value lost annually to delays in major cities²
30-50%
of retail locations fail within 3 years globally³
Billions of dollars flow into location-based decisions every year — property development, store openings, supply chain routes, insurance underwriting — all based on incomplete data. Organizations have perfected measuring the physical and financial — but they're flying blind on the social.
We believe location intelligence should be predictive, not reactive. It should tell you which neighborhood is ready to resist change 3 months in advance — not when it's already too late. That's the future we're building.
Developers and retailers have mastered the Financial Stack (Argus, Excel) and the Physical Stack (CoStar, Placer.ai). But the Social Stack remains unmeasured and unquantified.
Existing tools measure Activity (foot traffic) or Amenities (cafe count). But no digital tool reliably captures Adversarial Sentiment or Entitlement Risk.
This gap forces teams to rely on manual scouting of the district, like attending town hall meetings, and gut feelings to predict if a community will block their project—a "1990s workflow" for million-dollar decisions.
Great tools exist for brand monitoring (Brandwatch) and government policy (Zencity). But their architecture doesn't fit private sector location risk. Brandwatch is Entity-Centric — you search "Starbucks" and track brand mentions. Zencity is built for governments — not private developers. We are Geo-Centric: select a district or coordinates, and we capture all sentiment about that location — rent control protests, safety complaints, gentrification anger — regardless of what brands are mentioned.
Predictive
Detect opposition before you bid
Semantic
AI reads "I feel unsafe" not just "Crime"
Auditable
Click any score to see the source
Standardized
Compare any city instantly
Section B
The Entitlement Cliff — A Multi-Million Dollar Blind Spot.
Developers and retailers spend millions on physical due diligence and financial modeling. Existing tools (CoStar, Placer.ai, Esri) provide demographics, traffic, and infrastructure data — but they don't measure community sentiment or opposition risk. Even tools like Brandwatch (entity-centric, tracks brand mentions) and Zencity (built for governments) don't address private sector location risk. Teams still rely on manual site walks and town hall meetings to assess whether a neighborhood will fight their project. This blind spot costs HK$6-8M per year of project delay.
Community opposition is the #1 killer of real estate and retail projects
70%
of housing developments delayed by NIMBYism
41%
of retail locations fail within 5 years
15-25%
of project value lost annually to delays
A developer buys land in a major city. They plan to build apartments. The local community hates it. They protest. They sue. The project gets delayed 3 years. The developer loses 15-25% of the project value annually in carry costs. Yet their only tool for predicting this? Sending someone to a town hall meeting.
Placer.ai shows traffic is down 15%. But why? Is it safety? Parking? Gentrification anger? A boycott? GPS data can't tell you. We explain the "why."
Dataminr alerts you when the riot starts. But by then, the glass is already broken. Real estate is illiquid — you can't move your building. We detect the gas leak 6 months before the explosion.
Competitors like Dataminr are famous for sending alerts with no source citations. An Investment Committee won't approve a multi-million dollar deal on faith. We let them click the link and read the Reddit thread.
Supply chains and corporate travel teams rely on static risk reports. They miss the real-time sentiment shifts—like labor unrest or anti-foreign sentiment—that disrupt operations overnight. We detect "soft signals" before hard disruptions.
Great civic intelligence tools exist — but their architecture doesn't fit private sector location risk. Brandwatch is Entity-Centric (tracks keywords, not locations). Zencity is built for governments (not private due diligence). We are Geo-Centric: monitor a district, capture all environmental sentiment.
| Due Diligence Layer | What They Measure | Tools Used | Status |
|---|---|---|---|
| Physical Layer | Traffic, Buildings, Footfall, Zoning | Placer.ai, CoStar, SafeGraph | SOLVED |
| Financial Layer | Rents, Yields, Cap Rates, Tax | Argus, Excel, CoStar Comps | SOLVED |
| Demographic Layer | Income, Age, Education, Census | Esri/ArcGIS, Census Data | SOLVED |
| Social Layer | Community Sentiment, Trust, Opposition, "Vibe" | Site Walks, Town Halls, Brandwatch (limited), Zencity (limited) | BROKEN |
We don't replace these tools.
We are the "Social Layer" that completes their stack — digitizing the site walk and automating the town hall.
Section C
A Predictive Engine for Civic Intelligence.
We don't just show you what happened — we explain why it happened and predict what's coming next. Real-time scores + 5 years of historical data + AI-powered causal analysis.
Scalable infrastructure designed to ingest from 380,000+ sources across every major city
380,000+ Sources
Legacy tools search for words. We search for meaning. This is why we catch risks that keyword filters miss.
Traditional tools use Boolean keyword matching:
Problem: Misses posts like "I won't let my kids play outside anymore" or "The streetlights have been broken for months" — clear safety concerns without the keyword "crime."
Our LLM understands context and intent:
Advantage: Catches implicit sentiment, sarcasm, local slang, and complaints that don't use obvious keywords. Our geo-centric architecture captures all sentiment about a specific location — not just brand mentions — enabling true location-based risk assessment.
Our semantic AI works across major global languages and regional dialects — including Cantonese, Mandarin, English, and many more. This isn't just translation; it's cultural context understanding.
Hong Kong Example
Detects HK slang and colloquial Cantonese that formal tools miss.
Global Reach
Simultaneously analyzes English Reddit, Mandarin Weibo, Cantonese LIHKG, Japanese 2ch, and local forums — no keyword translation needed.
Why It Matters
Real community sentiment lives in local languages. Legacy tools miss 80%+ of relevant data by only processing English.
Competitors like Dataminr send alerts with no source citations — they protect their "IP." But an Investment Committee won't approve a multi-million dollar deal on faith.
Our Promise: Every score links back to the original source.
Example: "Safety Score dropped to 42 because of [15 Reddit threads about broken streetlights on 5th Ave]."
Your analyst can click the link and read the threads themselves.
Our data acquisition strategy prioritizes legal, licensed sources that scale to hundreds of thousands of feeds while maintaining full compliance.
Foundation Layer — Free to Low Cost
380,000+
sources
GDELT Project
300,000+ global news sources, 100+ languages
Free
NewsAPI
80,000+ sources with structured metadata
~HK$3,500/mo
Government Open Data
Municipal portals, World Bank, UN Data
Free
Licensed APIs — Moderate Cost
HK$7.8-39K/mo
estimated
Reddit Data API
Enterprise licensing for commercial use
~HK$1.87/1K calls
~HK$7,800/mo at scale
X/Twitter API
Basic to Pro tier access
HK$780-3,900/mo
Partnership Development — Phase 2
Partnerships
potentially
Regional forums (HKGolden, PTT, 2ch) and emerging market platforms require direct partnerships:
Total infrastructure cost: HK$3,900-15,600/mo for 380,000+ legally licensed sources
A comprehensive framework measuring the holistic health of any city down to the district level — not just crime stats or GDP
Each dimension is individually selectable for deep-dive analysis across any city and its districts in the database
Crime, public order, emergency response
Affordability, availability, quality
Jobs, wages, business climate
Policy trust, transparency, services
Infrastructure, accessibility, reliability
Air quality, green space, sustainability
Healthcare access, public health
Arts, entertainment, diversity
Schools, universities, opportunity
Innovation, connectivity, digital services
Social cohesion, belonging, trust
Affordability vs. income levels
Selectable
Click any dimension to drill down with extensive data, trends, and cited sources
Comparable
Compare any dimension across unlimited cities worldwide — Tokyo vs. London vs. São Paulo
Always Current
Continuous scraping solves the Latency Tax — real-time data, not 2-year-old snapshots
Not just scores — explanations of why they changed and predictions of where they're heading. Historical context meets predictive intelligence.
Imagine opening a single interface and seeing not just the current health score of every city, but why it changed and where it's heading. Our AI doesn't just report "Safety dropped 8 points" — it explains: "Safety declined due to 340% increase in housing protest coverage, correlated with new rent control policy announced March 3rd."
With 5 years of historical data per city, you can see patterns that predict future shifts. Which cities recovered fastest after similar governance crises? What leading indicators preceded the last 3 economic sentiment drops in Singapore? The Corporate Dashboard transforms you from reactive decision-maker to predictive strategist.
Organize your cities and districts into logical groupings that mirror your business structure.
Never miss a signal. Set custom thresholds at city or district level and get notified before problems escalate.
Go beyond the score. Understand WHY it changed and WHAT'S NEXT.
Make apples-to-apples comparisons across cities and districts worldwide.
PDF Reports
Audit-ready exports with full citations
CSV/Excel Export
Raw data for your own analysis
Interactive Charts
Embed live widgets in your tools
Scheduled Reports
Weekly/monthly automated briefings
Predictive intelligence on demand. Not just "what happened" — why it happened, what's coming, and what you should do about it.
Custom Reports answer the questions reactive data can't: "If Housing sentiment continues this trajectory, when will it cross our risk threshold?" or "Based on historical patterns, what's the 6-month outlook for Governance Trust in Jakarta?"
Our AI synthesizes 5 years of historical patterns with real-time signals to generate forecasts with confidence intervals. Each report explains the causal chain — not just "sentiment dropped," but exactly which policy changes, news events, and social conversations drove the shift, and what similar patterns have led to historically.
Where is this city or district heading? When should we enter?
• Market Entry Forecast: 12-month trajectory for any city or district with confidence intervals
• Trajectory Benchmarking: Compare momentum across cities/districts — who's rising, who's falling?
• Go/No-Go Recommendations: Optimal timing and entry strategy
• Leading Indicators: Early warning signals to monitor post-entry
• District-level granularity for hyper-local market entry decisions
Delivery: 20-30 page report (5-7 day turnaround)
What happened, why did it happen, and what can we learn?
• Event/Crisis Analysis: Exact causal chain that triggered the score change
• Root Cause Breakdown: Which policies, events, or conversations drove the shift?
• Historical Pattern Matching: How long did similar situations last elsewhere?
• Recovery Timeline Estimate: Based on comparable case studies
• Full citation trail for audit compliance and board presentations
Delivery: 15-20 page report (48-72 hour turnaround)
Scope Definition
Converse with AI Chatbot to clarify questions, success criteria & analysis scope
Data Extraction
Pull relevant signals from our database
Analysis
Human + AI synthesis of findings
Validation
Fact-check all claims with citations
Delivery
Report + presentation + Q&A session
Every report includes full source citations, methodology documentation, and executive summary for audit compliance.
Working prototype demonstrating proof-of-concept for key pipeline elements. Incomplete but functional.
City Coverage
100 cities operational — scalable to 1,000+
News Sources
Hundreds of outlets including wire services
Social Platforms
Reddit only — X, Weibo in Q1
Interface
3D globe + dashboard built
Backend data pipeline in action
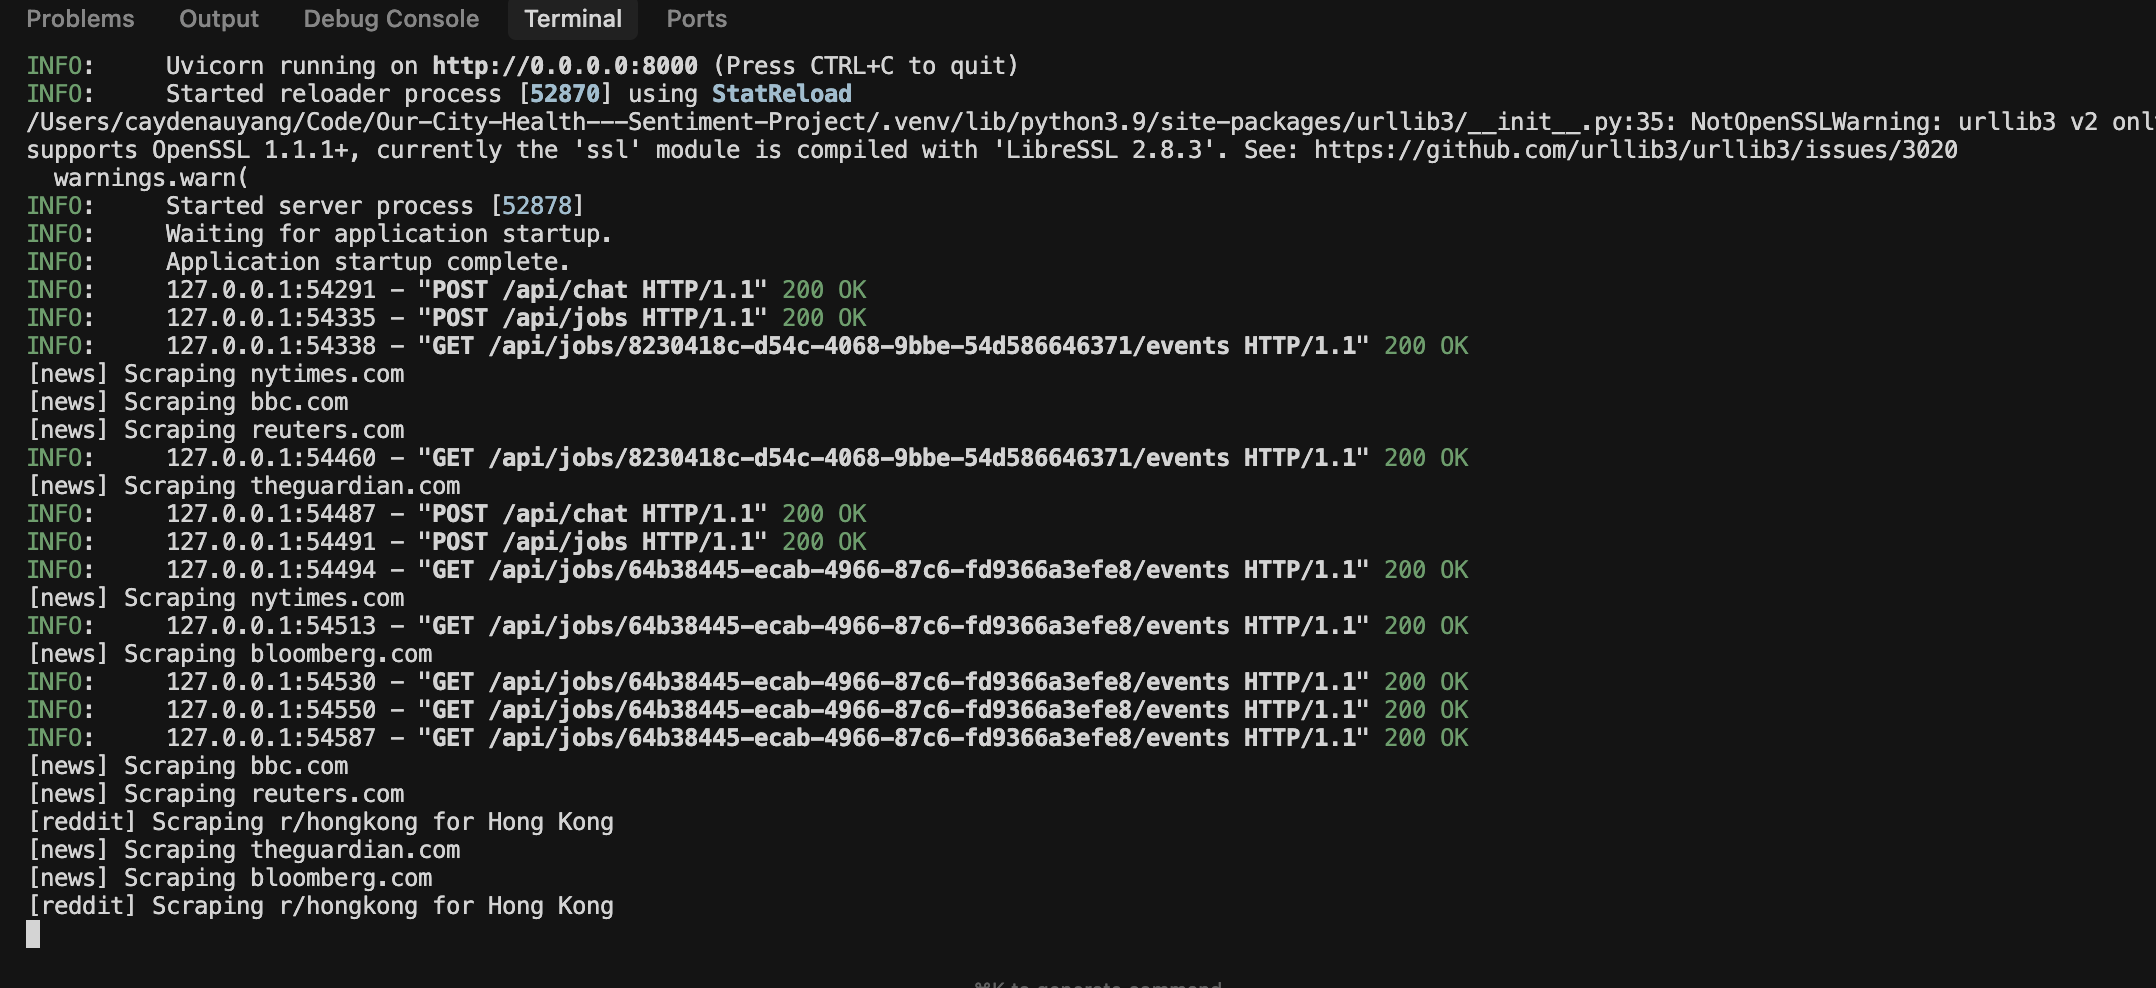
What you're seeing: The FastAPI backend running live scraping jobs. The engine ingests from multiple news sources (NYTimes, BBC, Reuters, The Guardian, Bloomberg) and Reddit communities simultaneously, processing data for the selected city (Hong Kong). This pipeline also handles AI-based scoring for each dimension through the proprietary scoring engine, which is currently under active development. Goal: Scale to 380,000+ sources via licensed APIs and data partnerships.
Public-facing visualization layer
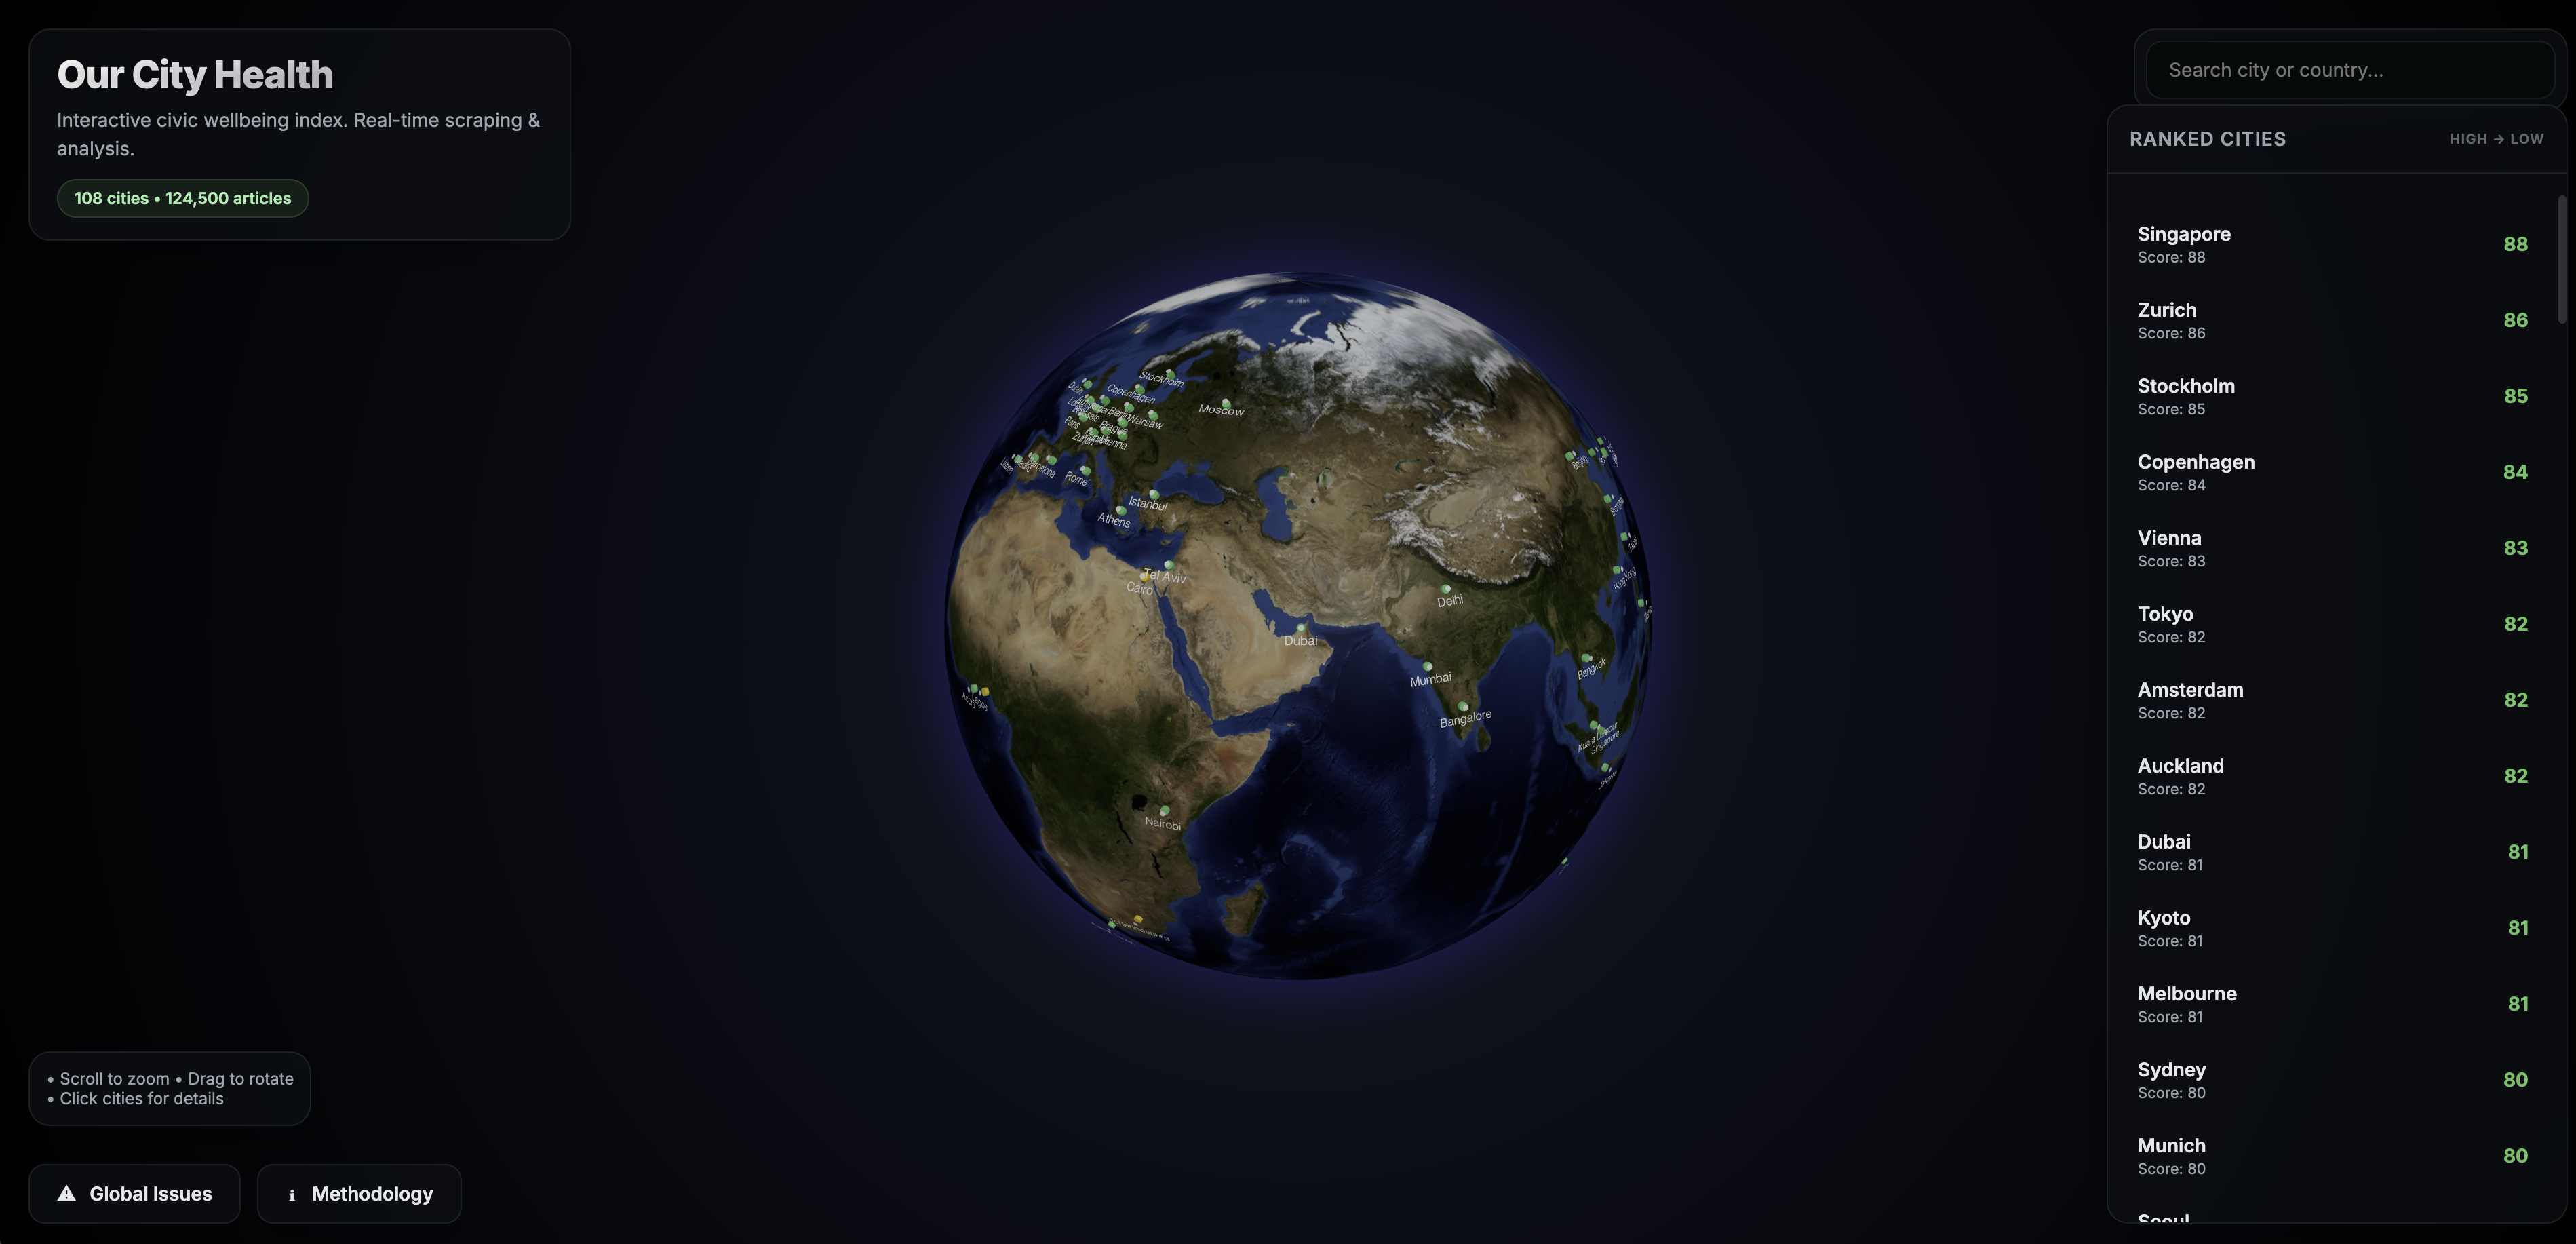
What you're seeing: A WebGL-powered 3D globe displaying real-time Civic Health Index scores for 108 cities. Users can rotate, zoom, and click on any city to see detailed scores across all 12 dimensions. Goal: Enable zooming to district-level with 12-dimension scores at district granularity.
Enterprise B2B interface (early prototype)
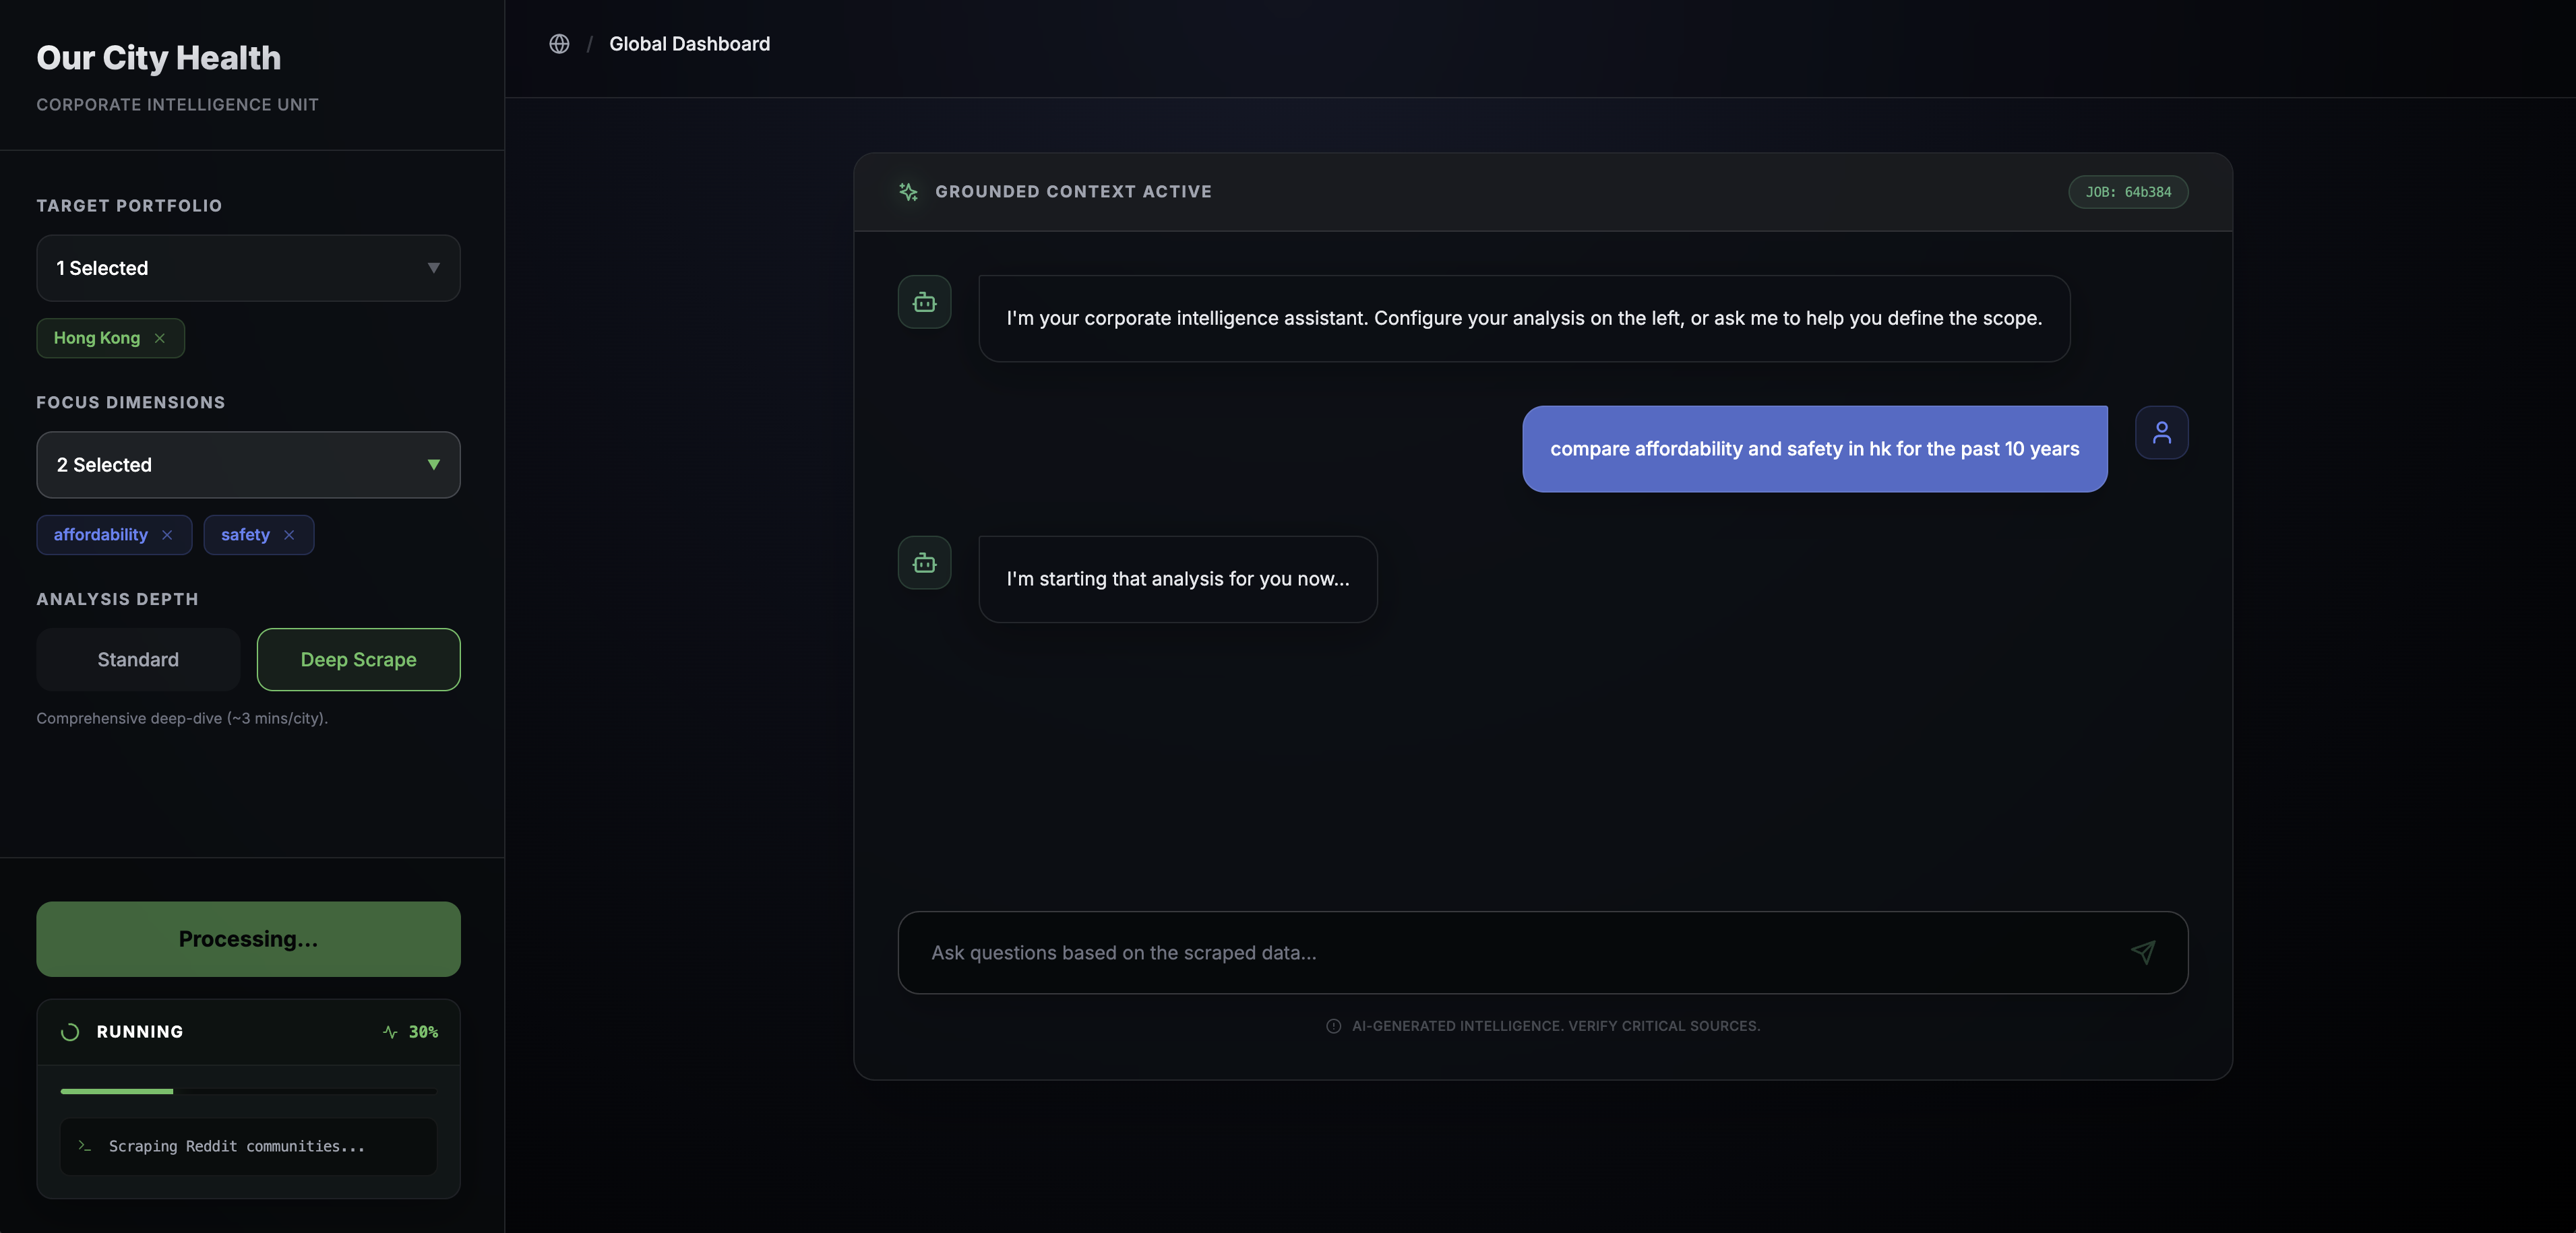
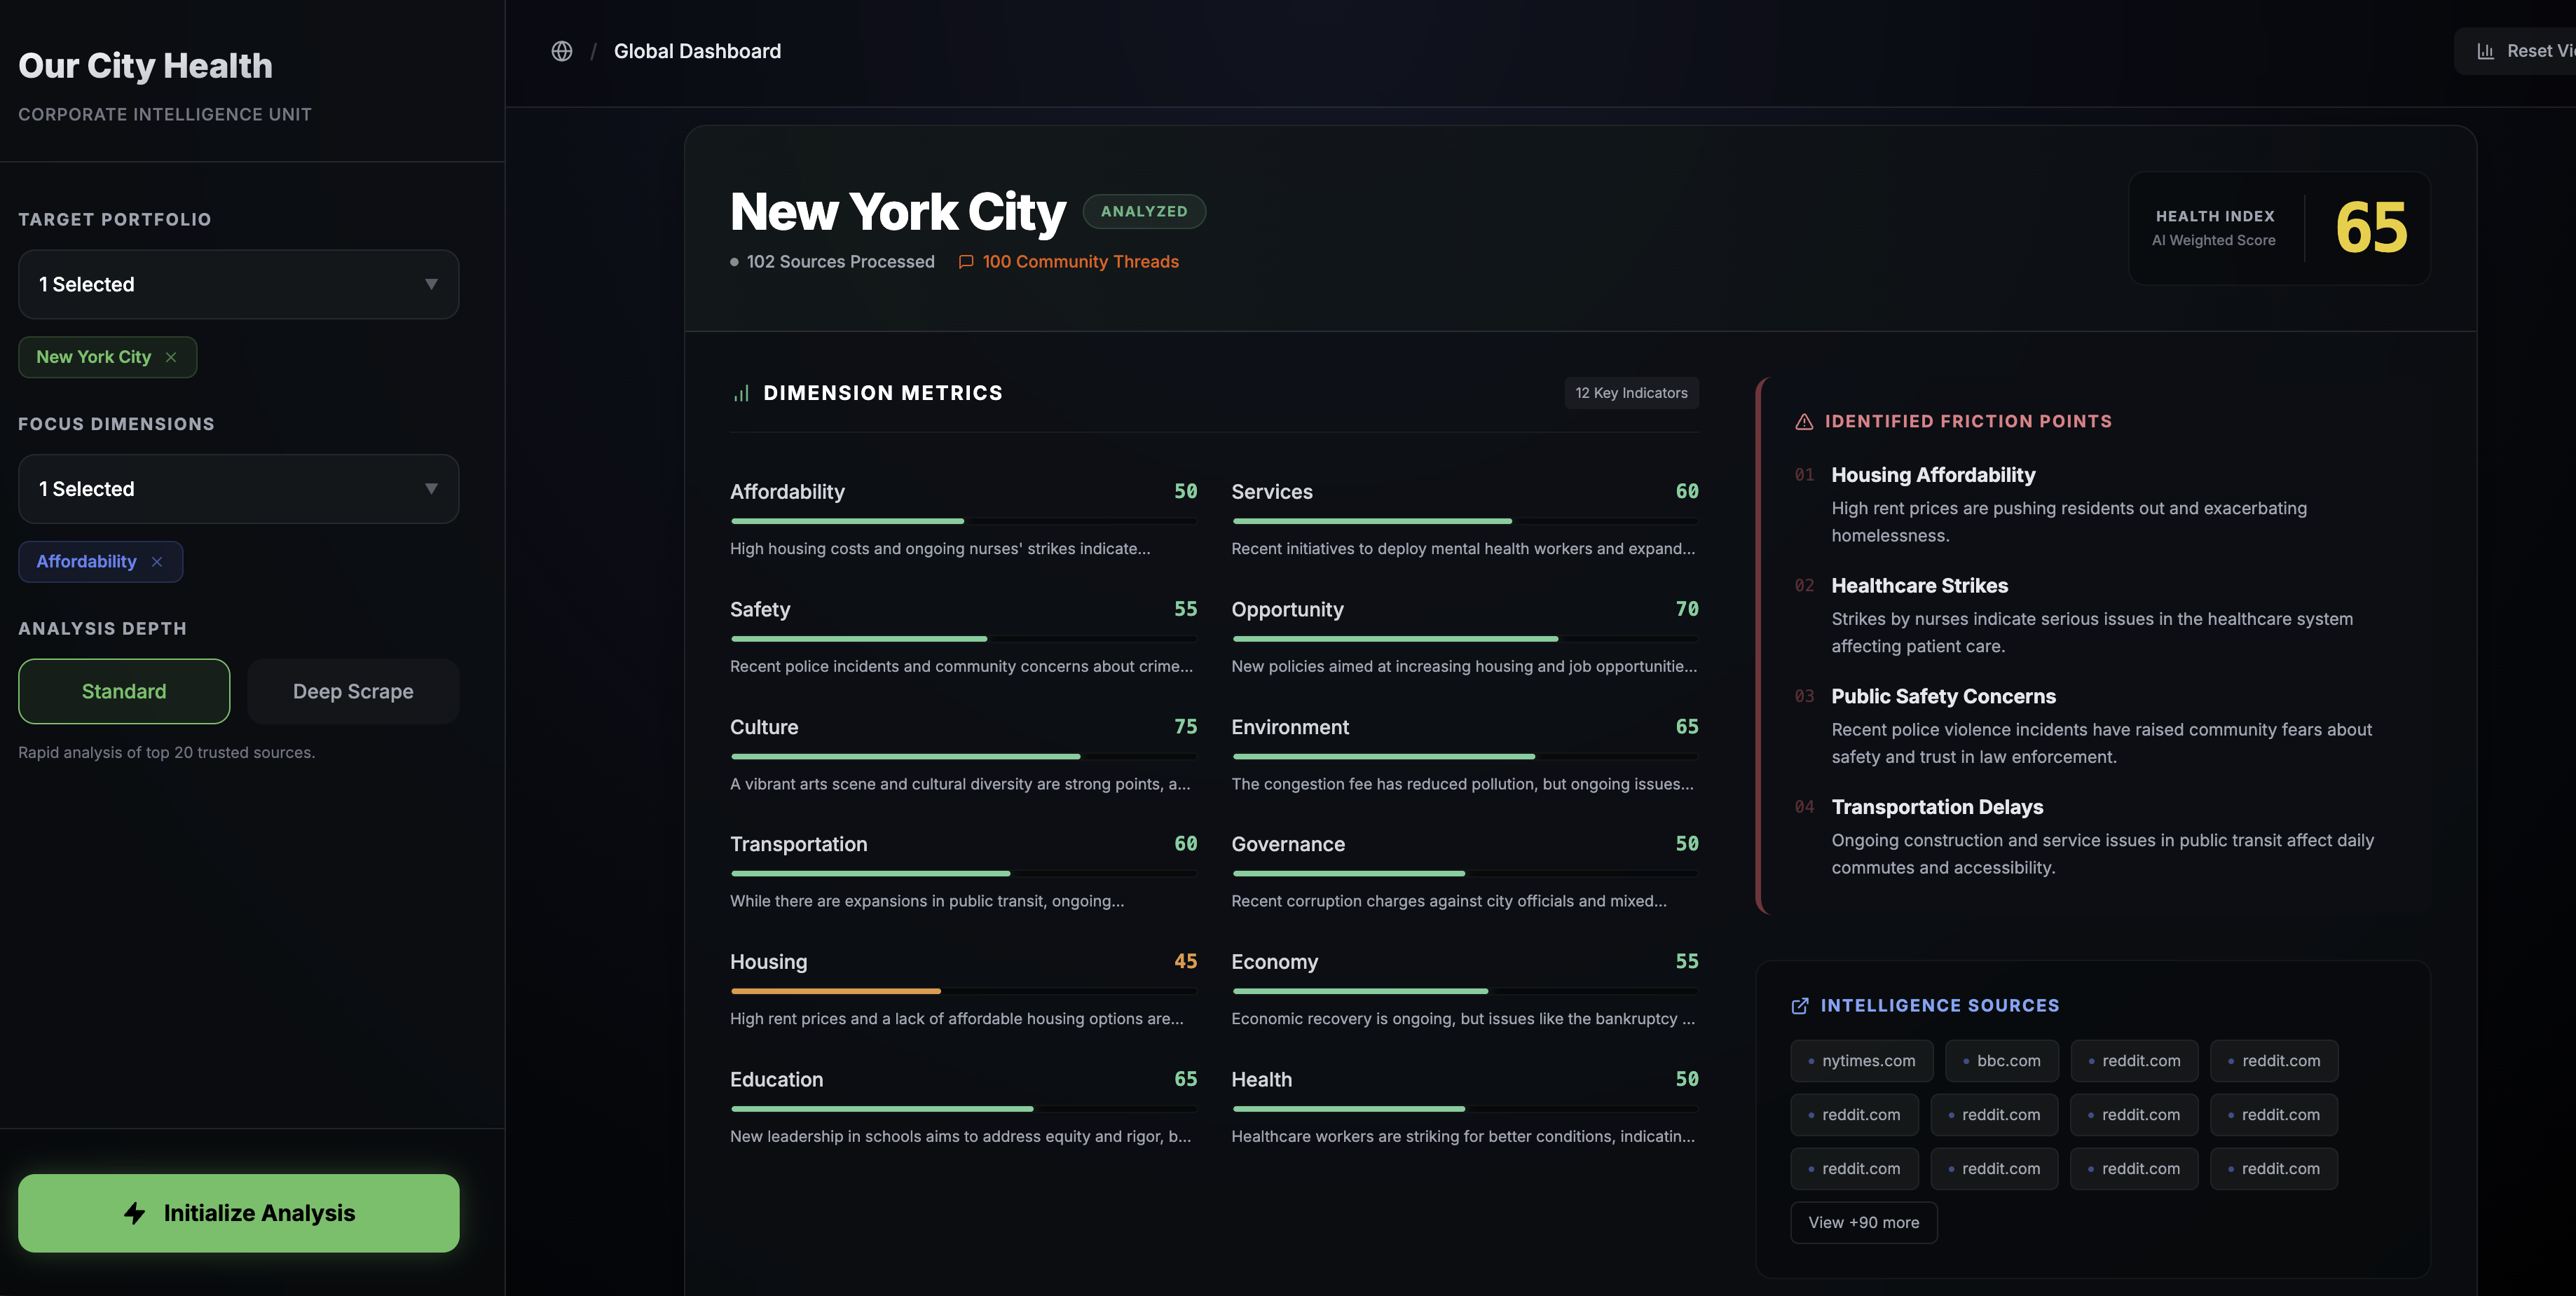
What you're seeing: Early prototype of the Corporate Intelligence Unit. Portfolio selection (Hong Kong), dimension filtering (affordability + safety), and a "Grounded Context" AI chat that answers questions using only scraped data — no hallucinations. The second image showcases an initial basic sample demonstration of city-level analysis across the 12 dimensions, powered by the foundational scoring engine currently in development. Goal: Custom portfolios, intelligent alerts, multi-location comparison, predictive analytics, full Custom Intelligence Report integration, and refinement of the 12-dimension proprietary scoring methodology (ongoing research into weighting algorithms and dimension interdependencies).
Status: Core infrastructure validated. These POC elements demonstrate the technical feasibility. Ready for Q1 scaling push.
Section D
The "Social License" Gap — A Blue Ocean in Site Intelligence.
The "Security" market is saturated (Dataminr). The "Traffic" market is dominated (Placer.ai). But there is no dominant player providing Qualitative Civic Health Trends to the private sector. We bring standardized civic health metrics to commercial strategy teams — measuring neighborhood sentiment, community cohesion, and social stability that existing tools miss.
Security Market
Dataminr, Control Risks
Saturated
Traffic Market
Placer.ai, SafeGraph
Dominated
Social License Market
Civic health tools (gov/public sector only)
Open for Private Sector
Focused on the "Social Layer" gap in site selection, operational monitoring, and community risk assessment — a subset of the broader commercial intelligence market.
Total Addressable Market
Global Real Estate & Retail Analytics Market — includes all data/analytics tools used for site selection, risk assessment, and market intelligence (Placer.ai, CoStar, Local Logic, Esri, consultancies).
Serviceable Addressable Market
Alternative Data & Sentiment Analytics — subset of companies actively seeking qualitative insights (social sentiment, community data) beyond traditional demographic/financial data.
Serviceable Obtainable Market
Year 3 Revenue Target — mid-size developers and retailers expanding internationally (APAC, Europe, North America) who lack reliable civic intelligence on unfamiliar markets.
We are launching with industries where "Community Sentiment" is a multi-million dollar blind spot and existing tools have clear gaps. This focused go-to-market strategy allows us to prove product-market fit before expanding to additional verticals.
Pre-Bid Community Screening
The User
VP of Development, Land Acquisition Manager
The Pain
Buy land in major city → community hates it → protests → lawsuits → 3-year delay → lose 15-25% of project value annually in carry costs
Current Solution
Existing tools (CoStar, Esri) provide demographics and physical infrastructure but miss community sentiment. Tools like Brandwatch track brand mentions (entity-centric) but not location-based sentiment — they can't tell you if a neighborhood opposes development. Developers still rely on manual site walks and town hall meetings to assess social opposition risk.
Our Value Proposition
Before bidding on land, run a "Civic Health Check" across the 12 dimensions for the specific city or district to quantify Entitlement Risk using real-time sentiment data. Set intelligent alerts to monitor sentiment shifts, conduct daily progress tracking during due diligence, run multi-region comparisons to identify lower-risk opportunities, and request Custom Intelligence Reports (20+ pages) analyzing historical resistance patterns, predictive timelines, and peer city benchmarks. Identify if the neighborhood has:
Low Community Cohesion
Fragmented — protests likely
Low Governance Trust
Anti-development sentiment
High Housing Stress
Gentrification anger brewing
"Anti-Delay Insurance" — know if a community will fight your project before you buy the land.
Target Companies:
Mid-size developers expanding internationally, regional developers entering unfamiliar markets, overseas land acquisition teams
The "Vibe Check" for Expansion
The User
Head of Real Estate, Site Selection Committee
The Pain
Open store in trending-down neighborhood → significant lost sales and operating losses → joins 30-50% that fail within 3 years
Current Solution
Placer.ai shows foot traffic numbers but not "why" traffic is trending. Tools like Brandwatch track brand mentions (entity-centric) but not location-based sentiment for specific districts. Site selection teams still rely on manual site walks and anecdotal local interviews to assess neighborhood sentiment.
Our Value Proposition
Run a "Civic Health Check" across the 12 dimensions for the specific city or district. Overlay our "Safety Sentiment & Cultural Vibrancy" scores on top of Placer.ai traffic data to explain trends and predict future performance. Compare multiple locations side-by-side across all dimensions, set alerts for sentiment threshold breaches, track daily score changes for shortlisted sites, and order Custom Intelligence Reports with market entry forecasts, trajectory benchmarking against peer locations, and 30/60/90-day sentiment projections:
Placer.ai says: "Traffic is high at this corner."
We add: "But 'Safety Sentiment' has dropped 15% in 6 months due to loitering complaints. Consider the mall 2 miles north instead."
Target Companies:
Regional QSR franchises expanding overseas, mid-size F&B chains entering new markets, CPG companies expanding international distribution
Parametric Risk Modeling
Use Case: If "Governance Trust" collapses in a region, riot risk goes up. Mid-sized domestic insurers need predictive civic signals but can't afford to build proprietary platforms.
Value: Parametric triggers based on real-time sentiment scores to adjust reserves and pricing.
Longer sales cycle, but validates deep tech credibility.
Policy Impact Measurement
Use Case: Real-time civic sentiment to understand policy effectiveness, identify emerging issues before escalation, and benchmark against peer cities or districts.
Value: Track trust and satisfaction scores across many dimensions in real-time. Continuous pulse checks vs. expensive annual surveys.
Validates product legitimacy and creates public case studies.
Supply Chain & Duty of Care
Use Case: Static risk reports miss real-time labor unrest or anti-foreign sentiment that disrupt port operations and executive travel overnight. Existing government-backed tools only send emergency high-risk alerts, not the soft signals that predict escalation.
Value: Live alerts for shipping hubs and travel destinations. Detect "soft signals" before hard disruptions.
Operations teams need daily intelligence, not quarterly reports.
Once core platform is validated with Physical Asset Owners and Operational Risk Teams, we will expand to: Quantitative trading firms (mid-size macro funds, municipal bond specialists). This is a crowded but addressable market once we have proven case studies and audit-ready data.
Local SMEs expanding overseas — we provide intelligence on unfamiliar markets
HK and GBA companies face massive information asymmetry when expanding internationally. While they know their home market intimately, they lack reliable civic intelligence on overseas destinations — especially in emerging markets and niche cities where data is scarce.
We fill that gap by providing standardized, real-time civic health data on smaller markets, second-tier cities, and regions that mainstream data providers don't cover well.
Our Value to HK/GBA Companies:
"You know Hong Kong. We tell you about everywhere else — especially the places where good data doesn't exist yet."
Our AI natively processes Cantonese, Mandarin, and English — including HK slang, colloquial Cantonese (粵語), and regional dialects. This isn't just translation; we understand cultural nuance and local context that generic tools miss.
Why it matters: When your HK-based F&B chain expands to Southeast Asia, we analyze sentiment in local languages (Thai, Bahasa, Vietnamese) — not just English summaries that miss 80% of real community conversations.
HK/GBA SMEs expanding globally are already in HKSTP's ecosystem — providing immediate, warm access to first customers.
Section E
We Don't Replace — We Complete.
Your customers already invest millions in specialized tools — from alert platforms (Dataminr, Placer.ai) to civic/marketing intelligence (Brandwatch, Zencity, Meltwater) to consultancies (McKinsey, Deloitte). We're not replacing these. We fill the geo-centric, location-based risk intelligence gap that none of them cover.
| Feature | Our City Health | Alert Platforms (Dataminr, Placer.ai) |
Civic/Marketing Platforms (Zencity, Brandwatch, Meltwater) |
GenAI Wrappers (Custom GPTs, Claude Projects) |
Consultancies (McKinsey, Deloitte) |
|---|---|---|---|---|---|
| Output Type | Structured Database + Alerts + Custom PDF Reports | Real-time alerts & traffic analytics | Sentiment dashboards & reports | Conversational text summaries | One-time strategic PDF reports |
| Time Horizon | Real-time + 5-year historical archive | Real-time only, limited history | Real-time with some historical | No memory between sessions | Point-in-time (6-12 mo lag) |
| Granularity | City + District level | Incident/Store level | City/Topic level (entity-centric) | Variable, depends on prompt | City/Country level |
| Audit Ready | ✓ Full source citations | ⚠ Some only | ✓ Yes | ✗ Hallucinates facts | ✓ Yes |
| Insight Level | "Why" (causal context & predictions) | "What/Where" (events & movement) | "What" (brand/policy sentiment) | "What" (creative synthesis) | "Why" (deep but lagging) |
Different tools answer different questions. Only one answers all five.
| Question for the Developer | Placer.ai | Dataminr | Brandwatch | Zencity | ChatGPT/Claude | McKinsey | Our City Health |
|---|---|---|---|---|---|---|---|
| "How many people are here?" | ✓ | ✗ | ✗ | ✗ | ✗ | ✗ | ✓ |
| "Did a disaster just happen?" | ✗ | ✓ | ⚠ | ⚠ | ✗ | ✗ | ✓ |
| "Is this neighborhood getting better or worse?" | ✗ | ✗ | ✗ | ⚠ | ✗ | ⚠ | ✓ |
| "Why are tenants/customers leaving?" | ✗ | ✗ | ⚠ | ✗ | ⚠ | ✓ | ✓ |
| "Will the community oppose our project?" | ✗ | ✗ | ✗ | ⚠ | ✗ | ✓ | ✓ |
Key Insight: Each tool excels at its niche, but none combines geo-centric location intelligence, real-time + historical data, and predictive entitlement risk in one pre-built package. That's our gap.
Brandwatch is Entity-Centric (tracks keywords). Zencity is built for governments. Neither architecture fits private sector location-based due diligence.
Brandwatch is Entity-Centric: You search "Starbucks" → it finds all mentions of "Starbucks" across the internet.
The Architectural Limitation:
Anti-gentrification protest outside Starbucks. Chants about "Rent Control" and "Capitalism." Nobody mentions "Starbucks."
Brandwatch sees: Nothing. The keyword wasn't used.
We are Geo-Centric:
Select a district or coordinates → we capture all sentiment about that location: rent protests, safety complaints, gentrification anger — regardless of what entities are mentioned.
"Brandwatch tracks the Brand. We track the Battlefield."
Brandwatch is an "Empty Box." Powerful, but requires custom setup per city.
The Hidden Cost:
Track "Civic Stability" across 50 global assets? You need complex boolean queries per city, per language. That's an ~HK$620K/year analyst just to maintain queries.
Our 12-Dimension Taxonomy:
Pre-built. Pre-translated. Works out of the box for 1,000+ cities. No query engineers required.
"Brandwatch is a DIY kit. We are the finished product."
Zencity is built for governments. Its product is designed for public sector policy feedback, not private sector due diligence.
Different Use Cases:
Governments need to understand citizen satisfaction and policy sentiment. Developers need to predict if a community will block their project.
A tool built for governments isn't designed for private developer risk assessment.
We are built for private sector location risk:
Is the neighborhood hostile to development? Will residents fight my project? Quantify the "Entitlement Risk" before you bid.
"Zencity serves governments. We serve developers and operators."
Unlike consumer data plays, civic intelligence requires navigating complex cross-border compliance — creating significant moats for early entrants.
Strict consent and data processing rules. Our aggregation-only model (no PII collection) ensures compliance while competitors struggle with individual-level tracking.
Cross-border data transfer restrictions. Our HK-based infrastructure enables GBA analysis while respecting mainland data sovereignty requirements.
PDPA (Singapore), APPI (Japan), LGPD (Brazil) — each market has unique rules. Early compliance investment creates 12-18 month head-start vs. new entrants.
Compliance complexity = competitive moat. We're building this foundation from Day 1.
Section F
A Scalable DaaS (Data-as-a-Service) Engine.
All prices in Hong Kong Dollars (HKD)
Try the platform
Lead generation & market validation
For growing teams
HK$18,000/yr billed annually
Full-featured intelligence
~HK$4,200/mo — most popular choice
Full API + integrations
Quant teams, data integrations, resellers
Unit Economics: Why These Margins Work
Data Infrastructure
HK$3,900-15,600/mo
GDELT (free) + NewsAPI (~HK$3,500) + Reddit API (~HK$7,800)
Compute / LLM Costs
Variable
Scales with usage; HKSTP compute support critical
Gross Margin Target
70-80%
Typical for SaaS data products at scale
From prototype to global platform
Section G
An AI-Native Founder with High Technical Velocity.
Architect & Founder
Based: Hong Kong / Connecticut, USA
Education: Pomfret School
Head of School Scholar
caydenauyang@gmail.com
+1 (646) 889-4501
+852 9260 9370
github.com/CaydenAuyang
Languages:
Expert in Agentic AI Workflows (Cursor + Google Antigravity). Capable of executing engineering tasks at 5x the speed of a traditional developer, keeping burn rate near zero. Founded a productivity consulting business and automation group, self-developed AI + automation projects like a macOS GUI agent and browser-based games ranging from FPS to educational games.
Founded a school-wide group with 20+ students and advisors dedicated to leveraging AI to automate workflows for school faculty and nearby communities. Serving 4 diverse departments with 10+ cases.
Founded productivity consulting business that weaves best-in-class AI tools with custom code pipelines to automate and streamline workflows of SMEs and nonprofits, cutting their tedious tasks and allowing for the reclaiming of hundreds of hours. Working with clients from 7 different industries.
Self-developed a multi-step program that scrapes for thousands of posts on RedNote and provides an in-depth analysis of the latest fashion trends and market strategies of four major sportswear brands through LLM analysis and API bridging. The analysis is granular, covering aesthetic choices, industry background, financial performance, customer sentiment, and future recommendations.
Self-developed a macOS-based, window-targeted GUI automation agent that combines computer vision (YOLO + OCR) with LLM reasoning to perform autonomous, goal-driven interactions across arbitrary apps and websites on a UI.
Dedicated Gap Year (2027). Will focus 100% full-time on scaling the venture post-graduation, with commitment to achieving product-market fit and first revenue.
Academic
Athletics & Arts
Key Advisor
Chief Information and Data Officer
Select Equity Group, L.P. (New York)
Former Roles:
Education:
17+ years leading data, analytics, AI, and technology teams at top-tier hedge funds and consultancies. Brings world-class expertise in alternative data strategy and enterprise-scale product development.
Section H
Strategic Alignment.
Scoring 1,000+ cities daily requires GPU inference at scale. HKSTP's supercomputing support is critical.
HKSTP's network of HK & GBA companies expanding globally provides immediate warm introductions to first customers.
Navigating PIPL, GDPR, and 50+ jurisdictions requires HKSTP's legal expertise.
Access to HKSTP's enterprise data partnerships for licensed API access (Reddit, regional sources, government feeds).
Ready to Build the Global Standard.
Geo-centric location intelligence for capital allocation decisions.
1,000+ cities. 380,000+ sources. 12 dimensions. One platform.